


$1.50 One-time license · lifetime download access
Buy Now charges your payment method right away — the resource appears under My Trainings → My Resources. Or add it to your cart and check out together with trainings.
Description
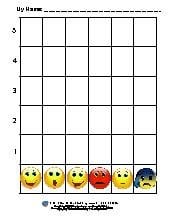
This 10-page printable Data Detective resource invites children to read a bar graph about favorite playground activities, with each square representing one child. Children practice finding totals, identifying the least popular choice, comparing quantities, and sharing an observation about the data. Use it for a focused math lesson, small-group practice, or an independent follow-up after collecting class survey results.
Other items you may like

+2


PDF$1.50
+2
PDFFree

+2


PDF$2.00

+2


PDF$1.99

+2


PDF$2.50

+2


PDF$1.75

+2


PDF$1.50

+2


PDF$1.75

+2


PDF$1.99


PDF$1.50

+2


PDF$1.99

+2


PDF$1.75
PDFFree
PDFFree
PDFFree

+2


PDF$1.75

+2


PDF$1.49

+2


PDF$1.75

+2


PDF$1.50

+2


PDF$2.50
