

$1.50 One-time license · lifetime download access
Buy Now charges your payment method right away — the resource appears under My Resources. Or add it to your cart and check out together with trainings.
Highlights
Pages1
TypePDF
SourceChildCareEd
Price$1.50 License available
License: ChildCareEd Resource License
Description
This printable worksheet invites children ages 5–6 to read a bar graph showing circles, squares, and triangles, with each square representing one shape. Children count each bar and answer questions about which shape appears most and least, how many circles there are, and the total number of shapes. Use it for a focused kindergarten math activity, graph-reading practice, or a quick independent review of counting and comparing quantities.
Other items you may like

PDF
Count the Dots: Equal or Not Equal? Counting and Comparing Worksheet for Ages 5–6
This 4-page printable helps children ages 5–6 count two groups of dots and decide whether they show the same or different amounts. Children practise one-to-one counting and early number compariso... Read more
4 pages
$1.50 Available for purchase
License: ChildCareEd Resource License

PDF
Count by Twos: Missing-Number Skip-Counting Worksheet for Ages 5–6
This printable worksheet helps children ages 5–6 practise counting by twos by completing an even-number sequence with the missing numbers. Invite children to say the sequence aloud together befor... Read more
3 pages
$2.00 Available for purchase
License: ChildCareEd Resource License

PDF
The Silly Monster Teaching Guide: Color, Shape Matching & Counting (Ages 3–5)
This 15-page printable teacher activity guide helps children ages 3–5 feed silly monsters while practicing color identification, shape matching, counting, and decision-making through pretend play... Read more
15 pages
$1.75 Available for purchase
License: ChildCareEd Resource License

PDF
Count the Corners: 2D Shape Vertices Worksheet for Ages 4–6
This 3-page printable helps children ages 4–6 identify shapes and count their vertices (corners), with a completed triangle example to show how to begin. Children look at each shape, count its co... Read more
3 pages
$1.49 Available for purchase
License: ChildCareEd Resource License

PDF
Build-a-Robot Shape and Counting Challenge for Ages 2–5
This 14-page printable activity invites children ages 2–5 to build a robot from shapes and pictures of everyday objects. Children match circles, squares, and rectangles, count robot parts, and fo... Read more
14 pages
Free
License: ChildCareEd Resource License

PDF
Recycling Data Investigation Guide: Classify, Graph, and Compare (Ages 6–12)
Use this recycling-themed mathematics investigation guide to help learners ages 6–12 classify clean packaging, collect and organize data, create and interpret graphs, compare totals, and support ... Read more
13 pages
$1.75 Available for purchase
License: ChildCareEd Resource License

PDF
The Bubble Investigation Guide: Compare, Observe & Count (Ages 3–5)
This 15-page printable guide helps educators prepare and supervise a short bubble investigation for children ages 3–5, with activity ideas and comparison cards. Children compare big and small bub... Read more
15 pages
$1.75 Available for purchase
License: ChildCareEd Resource License

PDF
Count the Shapes: Counting Groups and Matching Numerals 1–5
This printable counting activity helps children ages 3–5 count groups of shapes and circle the matching numeral from 1 to 5. The teacher-supported page includes a completed example, a learning go... Read more
8 pages
$2.00 Available for purchase
License: ChildCareEd Resource License

PDF
The Animal Counting Zoo: A Playful Counting Guide for Ages 3–5
This teacher’s guide for children ages 3–5 outlines an adaptable 15–20-minute small-group or individual zoo-animal counting session. Children practise one-to-one counting, matching groups to ... Read more
10 pages
$1.75 Available for purchase
License: ChildCareEd Resource License

PDF
Shape Detectives: Preschool Shape-Recognition Mathematics Guide (Ages 3–5)
This teacher’s mathematics guide provides a preschool sequence for recognizing and comparing circles, squares, triangles, and rectangles. Children practice noticing edges and corners, finding sha... Read more
18 pages
$1.75 Available for purchase
License: ChildCareEd Resource License

PDF
The Little Fruit Market: Counting 1–5 Pretend-Play Guide for Ages 3–5
Prepare a pretend fruit-market activity that helps children ages 3–5 count fruit from 1–5, match numerals to quantities, and collect a requested number of items. The guide also encourages one-t... Read more
11 pages
$1.75 Available for purchase
License: ChildCareEd Resource License

PDF
Train Cargo Counting: One-to-One Correspondence and Numbers 1–5 for Ages 3–5
This printable train-car mat and cargo-box activity helps children ages 3–5 connect numerals with quantities from 1 to 5. Children cut out the boxes, name each car’s numeral, and place one box ... Read more
6 pages
$2.00 Available for purchase
License: ChildCareEd Resource License
PDF
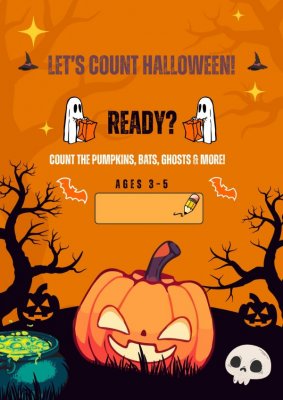
Let's Count Halloween! Fun Preschool Counting Activity (Ages 3–5)
Make early math learning fun and festive with this 3-page Halloween Counting Activity, designed for preschoolers ages 3–5!
This colorful, Halloween-themed printable helps young learners practi... Read more
3 pages
$1.50 Available for purchase
License: ChildCareEd Resource License

PDF
Help the Spider Count Its Legs: Counting and Number Matching for Ages 2–5
This printable counting activity invites children ages 2–5 to count each spider’s legs and match the spider cards to the number mat with the same count. An adult can help cut out the cards, and... Read more
5 pages
$3.50 Available for purchase
License: ChildCareEd Resource License

PDF
Build-a-House Shape Templates: Halloween Shape Activity for Ages 3–5
Children ages 3–5 use the printed house templates and shape pieces to build a Halloween house with circles, squares, rectangles, and triangles. They practise naming shapes, noticing how shapes fi... Read more
25 pages
$2.00 Available for purchase
License: ChildCareEd Resource License

PDF
The Counting Carnival: A Teacher’s Guide to Counting 1–10 for Ages 3–5
Plan playful counting sessions with this teacher’s guide for preschool children ages 3–5. Children practise recognizing numerals 1–10, counting objects one at a time, connecting the final cou... Read more
9 pages
$1.99 Available for purchase
License: ChildCareEd Resource License

PDF
Read and Talk Together: Family Reading Feedback Form for Ages 2–5
This four-page printable invites families to share feedback after reading a book or enjoying a reading activity with a child ages 2–5. Caregivers can write, draw, or dictate what the child enjoye... Read more
4 pages
Free
License: ChildCareEd Resource License

PDF
Count the Pumpkins: Counting and Tracing Maze for Ages 2–5
This 8-page printable invites children ages 2–5 to count pumpkins and trace a path to help a pumpkin reach its patch. Children practise early counting while building fine-motor control and pre-wr... Read more
8 pages
$2.50 Available for purchase
License: ChildCareEd Resource License

PDF
Count, Color, and Cut the Leaves: Autumn Counting Worksheet for Ages 2–5
This six-page autumn printable invites children ages 2–5 to count groups of leaves, say or point to the matching number, and color the picture. Children who are ready can also practise cutting al... Read more
6 pages
$2.50 Available for purchase
License: ChildCareEd Resource License

PDF
Count the Magical Treasures: Drawing and Counting Worksheet for Ages 3–5
Invite children ages 3–5 to design their own magical treasure collection in a large drawing area, then record how many treasures they found. This 8-page printable gives children practice counting... Read more
8 pages
$2.00 Available for purchase
License: ChildCareEd Resource License
